Bitcoin Dominance at 58.9%: Why Altseason Still Hasn't Started
Bitcoin's share of total crypto market capitalization is holding near 59%, but money is being reshuffled inside the market: XRP gained almost 50% in the week to 9 September, and ETH, SOL and XRP funds are drawing inflows while BTC ETFs see outflows. We break down what dominance shows and what it misses.
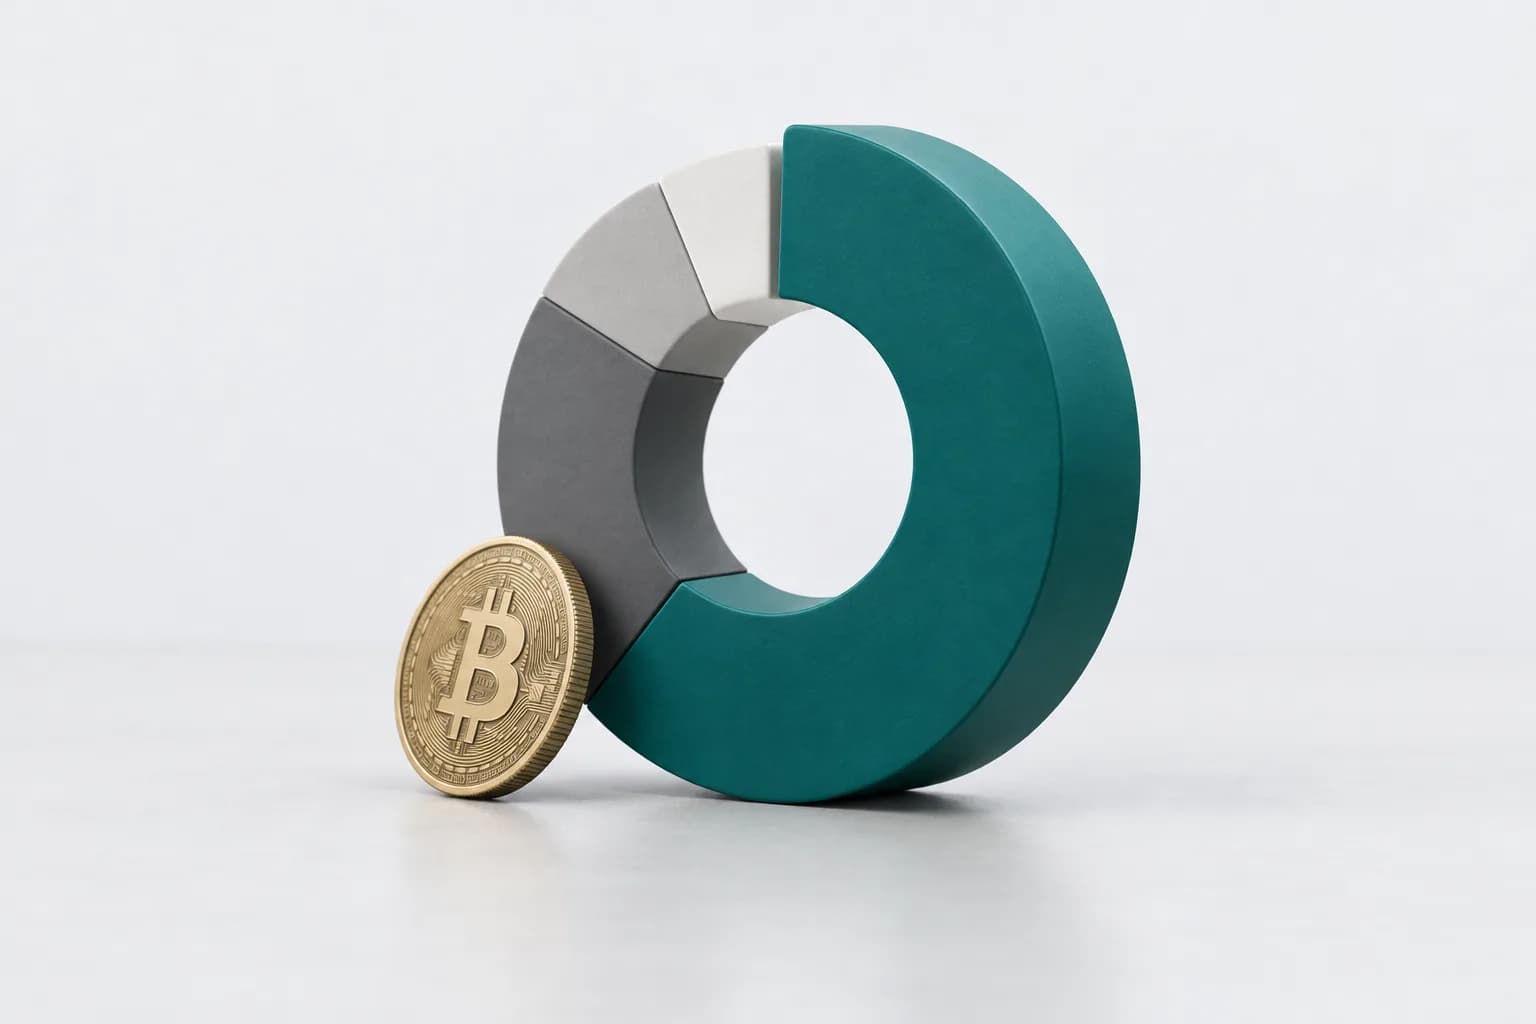
In brief: As of 14 September 2026, bitcoin dominance stands at 58.9% of total crypto market capitalization of $2.65 trillion (CoinGecko data). The metric has added about 0.9% over the past month and 3.2% over the past year (TradingView, BTC.D). Formally, this means there is no altseason: capital is not flowing from bitcoin into altcoins on a broad front. But in 2026 the metric itself has become far less informative than is commonly assumed, and alongside rising dominance there is a noticeable rotation of institutional money into ETH, SOL and XRP.
Market structure on 14 September 2026: the numbers
| Asset | Market share | Market cap | Price | 24h change |
|---|---|---|---|---|
| Bitcoin (BTC) | 58.90% | $1.564 trillion | $77,812 | +1.52% |
| Ethereum (ETH) | 11.56% | $306.9 billion | $2,511.93 | +1.46% |
| Tether (USDT) | 6.91% | $183.4 billion | $0.9997 | — |
| BNB | 3.62% | — | — | — |
| XRP | 3.33% | $88.4 billion | $1.40 | +4.61% |
| USD Coin (USDC) | 2.79% | $74.2 billion | $0.9998 | — |
| Solana (SOL) | 2.25% | $59.8 billion | $101.74 | +2.03% |
| TRON (TRX) | 1.22% | — | — | — |
Source: CoinGecko API, single snapshot taken on 14 September 2026. Total market capitalization is $2.652 trillion. Dashes mark fields where individual metrics for the asset were not exported at the time of the snapshot.
What bitcoin dominance actually shows
Dominance (BTC.D) is the ratio of bitcoin's market capitalization to the total capitalization of the crypto market. The metric emerged when the market consisted almost exclusively of BTC and a small number of altcoins, and its reading was straightforward: dominance falls, money is moving into altcoins. Today the calculation carries two systemic distortions that are rarely written about.
First: stablecoins sit in the denominator. USDT and USDC together account for 9.7% of the market, or roughly $257.6 billion. These are not "altcoins" that anyone rotates risk into; they are a settlement layer. When traders move into cash, stablecoin capitalization grows, the denominator expands, and bitcoin dominance falls mathematically even though appetite for altcoins has not grown by a single dollar. The reverse is also true.
Second: different sources calculate it differently. TradingView's BTC.D index takes the 125 largest cryptocurrencies; CoinGecko and CoinMarketCap use their own lists and their own methods for handling wrapped and locked tokens. A discrepancy of 1–2 percentage points between charts is the norm, not an error. It makes sense to compare the trend within a single source rather than absolute values across different ones.
Hence the conclusion: dominance is an indicator of market structure, not a buy signal. The rule of thumb that "altseason begins when dominance drops below 48–50%," which circulates through Russian-language articles, rests on the 2017 cycle, when there were almost no stablecoins in the denominator, and does not carry over mechanically to 2026.
Why there is no altseason even though altcoins are rising
The Altcoin Season Index (Blockchain Center) stood in the 42–51 range at the end of August 2026. It shows what share of the top 50 coins outperformed bitcoin over 90 days; readings above 75 are considered altseason, below 25 bitcoin season. The current level is dead center: the market has not picked a side.
At the same time, individual assets are moving very sharply. Over the seven-day window to 9 September 2026, XRP gained about 50% and briefly reached $1.70 (24/7 Wall St., 9 September 2026); by 14 September it had pulled back to $1.40, giving up a sizable part of that move in less than a week. On a monthly basis as of 9 September, BTC, ETH, XRP and SOL each posted gains of more than 20% while remaining down year to date. This is a crucially important detail: the upward move is coming off a low base and is so far recovering, not exceeding, the levels of early 2026.
That is what a segmented market looks like, not an altseason: it is not "everything that isn't bitcoin" that is rising, but specific stories with their own drivers.
Three drivers moving altcoins right now
1. Regulatory recognition. On 5 September 2026, the SEC formally placed Solana alongside bitcoin and ether for the purposes of commodity trusts. This removes part of the uncertainty for fund issuers and directly affects the ability to launch new products.
2. Technical upgrades with measurable effects. On 3 September, the Solana Foundation launched Payment Channels, a mechanism designed to sharply increase throughput. The Alpenglow upgrade, rolling out from August through October, aims to cut transaction finality time from 12.8 seconds to roughly 150 milliseconds. This is not "news for the sake of news" but a change in the network's product characteristics on which its usability in payments depends.
3. Institutional flows. Over the four sessions of 8–11 September, spot bitcoin ETFs lost $462.73 million, while ETH funds attracted $197.11 million (a fourth consecutive positive week), XRP funds $18.98 million, SOL funds $10.3 million and LINK funds $5.36 million (SoSoValue data). Solana and XRP funds entered September with roughly $1.5 billion in assets each. At the same time, the HYPE ETF posted the largest outflow among altcoin funds, $26.42 million, which underscores the selectivity: institutions are not buying "altcoins in general." We examine the macro context of this rotation in our piece on the Fed and Bank of Russia rates.
What popular altseason breakdowns miss
The articles ranking at the top of search results for altseason 2026 queries share typical problems: no tables or links to the primary source of the Altcoin Season Index, a dominance threshold carried over from the 2017 cycle without adjusting for stablecoins, and occasional promises of "10x–50x" returns. The latter is marketing, not analysis: no methodology allows such figures to be cited as an expected outcome.
What to check instead:
- Dominance excluding stablecoins, calculated as BTC market cap divided by total market cap net of stablecoins. It shows the real distribution of risk.
- The Altcoin Season Index, a 90-day comparison of the top 50 against bitcoin, available on Blockchain Center.
- Spot ETF flows for each asset. SoSoValue and Farside publish daily data. This is the most honest indicator of institutional demand.
- Stablecoins' share of market capitalization, currently 9.7% for USDT and USDC alone. A rising share usually means a move into cash.
- Trading volume in the altcoin/BTC pair, not just against the dollar. An altcoin whose price rises while its BTC exchange rate falls is not altcoin strength but dollar weakness.
What's next: three forks in the coming days
15 September: the US Senate vote on the CLARITY Act. Republicans have presented a reworked 630-page version with more than a hundred changes. For altcoins this is the key story: the law defines which assets the SEC regulates and which fall to the CFTC, and ETF launches and US listings depend directly on that classification.
16 September: the Fed decision. Monetary tightening has historically hit high-beta assets harder than bitcoin, so a rate hike could pause the current rotation into altcoins.
October: completion of the Alpenglow rollout on Solana. If the stated finality parameters are confirmed on mainnet, it will strengthen the case for the payment use cases we write about in our piece on stablecoins and settlement.
Bottom line: dominance of 58.9% with an Altcoin Season Index near 50 is a state of equilibrium, not the start of a trend. The pattern "altcoins rally after dominance declines" describes past cycles and is not a mechanism that is obliged to work again; in 2026, market structure is shaped more by regulatory decisions and exchange-traded fund flows than by the halving calendar.
Sources
- CoinGecko API: market capitalization, market shares and prices as of 14 September 2026
- TradingView, BTC.D bitcoin dominance index — https://ru.tradingview.com/symbols/BTC.D/
- "Outflow of $462.7 million ends spot bitcoin ETF inflow streak" (SoSoValue data), 12 September 2026 — https://www.gncrypto.news/ru/news/ottok-4627-mln-prerval-pritoki-spotovyh-bitcoin-etf/
- "Bitcoin falls 5% and Trump's concessions," 14 September 2026 — https://finance.mail.ru/article/bitkoin-upal-na-5-i-ustupki-trampa-glavnoe-o-kriptovalyutah-na-utro-69227549/
- 24/7 Wall St. on the monthly performance of XRP, BTC, ETH and SOL, 9 September 2026 — https://247wallst.com/investing/cryptocurrency/2026/09/09/xrp-bitcoin-ethereum-and-solana-are-all-up-more-than-20-in-a-month-and-still-down-for-the-year-which-recovers-first/
- Overview of the new phase for crypto ETFs in September 2026 — https://bitcoinfoundation.org/news/bitcoin/crypto-etfs-enter-a-new-phase-in-september-heres-what-investors-should-watch/
- Reference material on the dominance calculation methodology — https://crypto.ru/dominacii-bitcoin/